 |
IceCube display
LED display to show IceCube event data
|


|
|
IceCube display
LED display to show IceCube event data
|
|

The IceCube Neutrino Observatory is a high energy neutrino and cosmic ray detector located at the Amundsen-Scott South Pole Station. Its main components – IceCube and DeepCore in the deep-ice, and IceTop at the glacier's surface – consist of thousands of Digital Optical Modules or DOMs that detect Cherenkov light emitted by particles travelling through the ice. To be able to represent the information about the captured light, a number of LED displays have been developed over time. These displays use an (RGB) LED to represent a single DOM or a cluster of DOMs. Detection time is usually mapped to color, and the amount of light detected is mapped to brightness. This documentation accompanies the firmware that was originally written to drive the displays built at Ghent University, and serves to provide details on how to implement new displays in the same framework.
To simplify the LED driving, the displays use RGB LED packages that include a driver and serial communications such as the WS2812B or APA102. These are then driven in turn by a microcontroller that also sports a USB port to provide connectivity to a PC. By allowing the PC to send frames of raw RGB LED data, these displays are essentially a generic video display, albeit one arranged in a rather odd layout that matches the IceCube detector.
To start designing your own display (firmware), the following resources can be usefull:
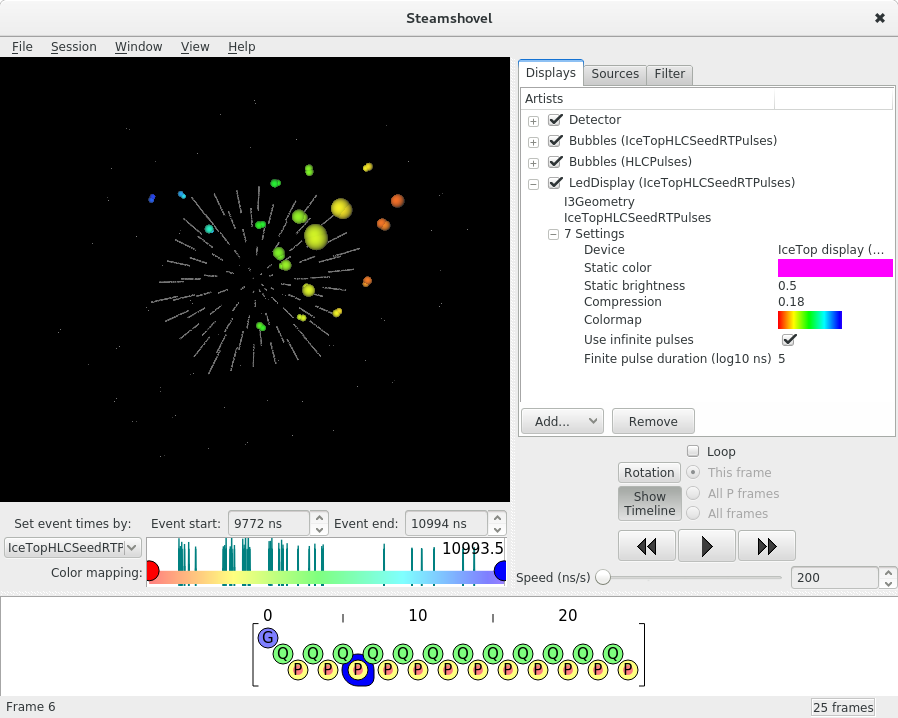
The device's USB port can be used to transfer display data from a USB host. A detailed overiew can be found in the firmware documentation. A Steamshovel artist has been implemented using this connectivity to be able to display any simulation or data file.
The options of the LedDisplay artist have been modelled after the Bubbles artist:
 1.8.13